
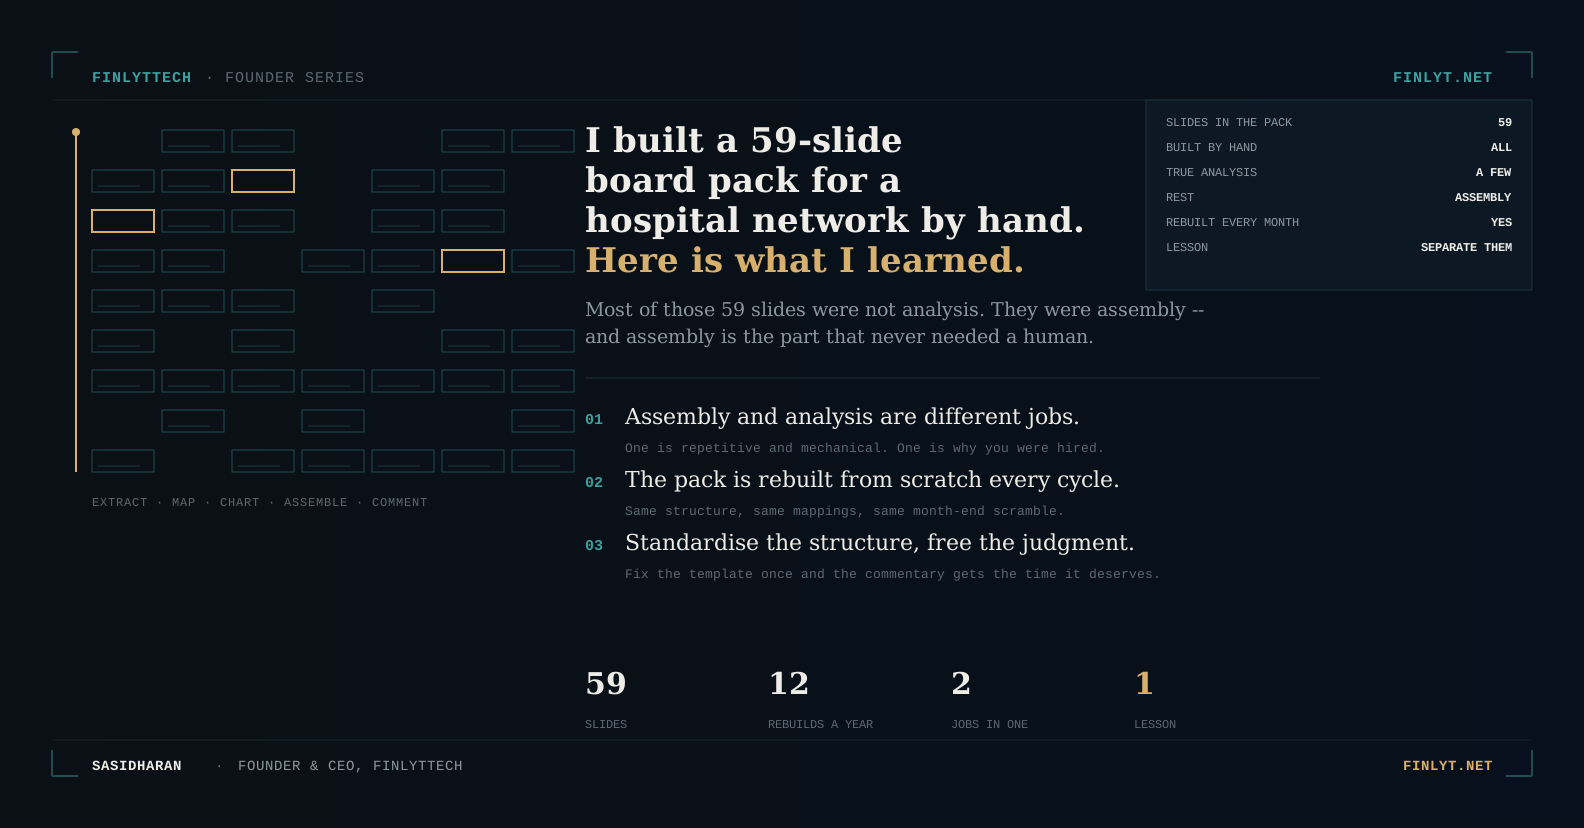
The brief arrived in October. A hospital network — 20 hospitals across three states — needed a consolidated board pack for the annual strategy review. Revenue across all entities: approximately ₹340 Crore. Data format: 20 different Excel files, three different accounting systems, and one Tally installation that had been customised so heavily it was unrecognisable.
I built that pack by hand. 59 slides. Six weeks.
It is the best thing I ever did for understanding why FinLytTech needed to exist.
What month-end actually looks like — before automation
Most people who have not done this work imagine financial consolidation as a reasonably clean process: you take the numbers from the accounting system, put them in a template, and the template does the work.
The reality is different.
Each of the 20 hospitals had a different Chart of Accounts structure. What one entity called ‘consultancy fees’ another called ‘medical professional charges’. What one classified as a direct cost another had coded as an administrative expense. Before a single number could be consolidated, every account code had to be mapped to a standardised structure.
That mapping exercise alone took eleven days.
Then the inter-company eliminations. Three of the 20 hospitals were leasing facilities from a holding company within the same group. Those lease payments were income for the holding company and expenses for the operating entities — and both needed to be eliminated from the consolidated P&L before it meant anything.
Then the currency question. Two hospitals in a Union Territory with a different statutory structure required a translation adjustment.
Then the commentary. The board did not want to read numbers. They wanted to understand what drove the variance between Hyderabad and Ahmedabad. Why one hospital’s EBITDA margin was 22% and another’s was 9%. What the debtor ageing in the insurance receivables segment was telling them about collection process quality.
The three things I learned that I could not have learned any other way
The first thing I learned is that the delay in financial reporting is almost never a data problem.
The data exists. It has existed from the moment the transaction was recorded. The delay is a translation problem — converting raw transaction data into a format that answers management questions.
Every hour spent on the hospital pack was an hour spent translating. The translation is what takes time. And the translation is exactly what a well-designed system can do automatically.
The second thing I learned is that the commentary matters more than the numbers.
The Hyderabad hospital’s 22% EBITDA margin was unremarkable on its own. The insight was that it had improved from 16% two years earlier because of one operational change: centralised procurement for consumables had reduced the cost of materials by 4.2 percentage points. That story — the driver behind the ratio — was not in any accounting system. It required someone who understood the operations to connect it.
The third thing I learned is that the working capital section is always the most revealing part of any MIS.
The P&L tells you what the business earns. The working capital tells you whether it actually has the cash to continue operating. In the hospital pack, three entities with excellent P&L performance had debtor ageing profiles that signalled serious collection problems — insurance claims sitting in the 91-180 day bucket that were effectively stuck pending dispute resolution. The P&L looked fine. The cash position was fragile.
From manual to automated — what changed and what did not
Building FinLytTech’s MIS engine, I drew directly from the hospital pack experience — and from every other board pack, investor MIS, and due diligence data room I had built or reviewed in fifteen years.
The Chart of Accounts mapping problem — the eleven-day manual exercise — became the COA Intelligence Engine: a system that learns account code mappings across different company structures, improving with each new entity connected. What took eleven days manually now takes minutes.
The commentary problem — the human insight that connects numbers to drivers — remains partially human. FinLytTech generates the financial narrative: the variance analysis, the trend identification, the ratio context. But the operational insight — why the Hyderabad margin improved — still requires someone who knows the business. AI handles the financial translation. The advisor handles the operational interpretation.
The working capital problem is now automated: debtor ageing, cash conversion cycle, concentration analysis. All computed monthly, automatically, without anyone having to build a pivot table.
Why this origin story matters for every founder using FinLytTech
The tools built by people who have done the work manually are different from the tools built by people who have modelled the process theoretically.
When FinLytTech flags that a debtor’s ageing is deteriorating, it is flagging it because someone who has sat in rooms where that deterioration became a crisis knows what it means in practice. When the cash flow forecast models a payment delay scenario, it is modelling the specific scenario that actually destroys businesses — not a theoretical one.
The fifteen years of manual work that preceded FinLytTech were not inefficiency. They were research.
What manual financial work are you doing right now that you would not need to do if the right tool existed? What would you do with that time instead?
FinLytTech automates the MIS that took six weeks to build by hand. The demo is at finlyt.net — no login needed.